Infographics - Data visualizations
___
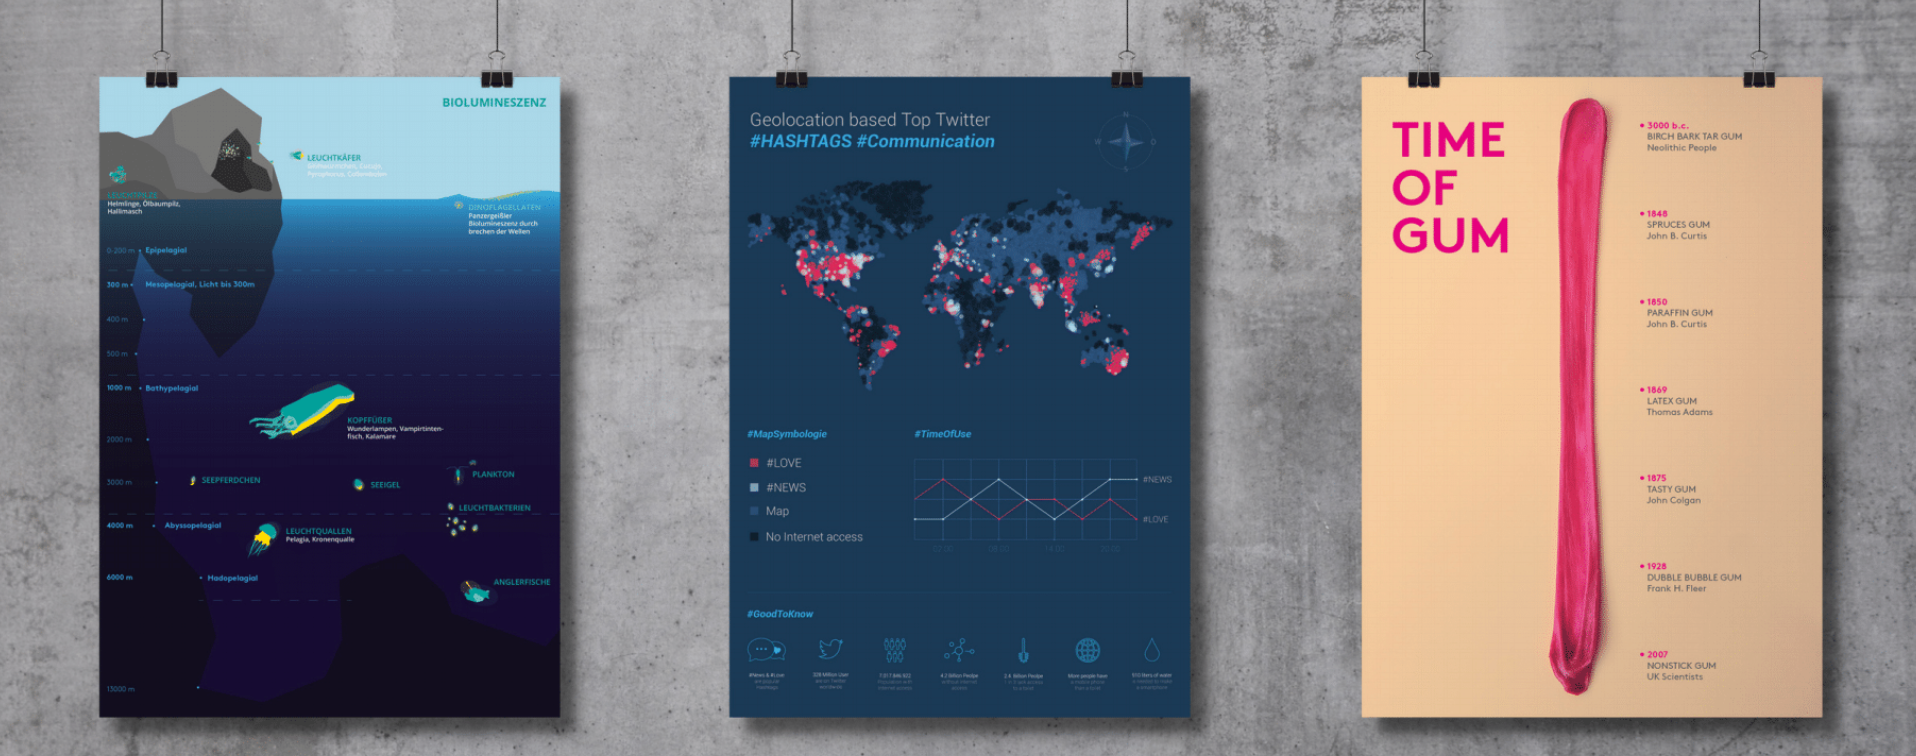
Complex data and content explained simply. Infographics as visual storytelling. In a collaborative publication, the newspaper "Informer", by the communication designer and typographer Indra Kupferschmid, I and my fellow graduates were allowed to create different infographics. For self-researched content and complex topics.
Print Design / Illustration / Data Visualization / Typography / Icon Design